Categories
- All Categories
- 5 Oracle Analytics Sharing Center
- 11 Oracle Analytics Lounge
- 195 Oracle Analytics News
- 41 Oracle Analytics Videos
- 15.5K Oracle Analytics Forums
- 6K Oracle Analytics Idea Labs
- Oracle Analytics User Groups
- 68 Oracle Analytics Trainings
- 14 Oracle Analytics Data Visualizations Challenge
- Find Partners
- For Partners
Welcome to the Oracle Analytics Community: Please complete your User Profile and upload your Profile Picture
Major League Baseball (MLB) Salary Distribution & Trends (1996-2016)

User_J2JMI
Rank 3 - Community Apprentice
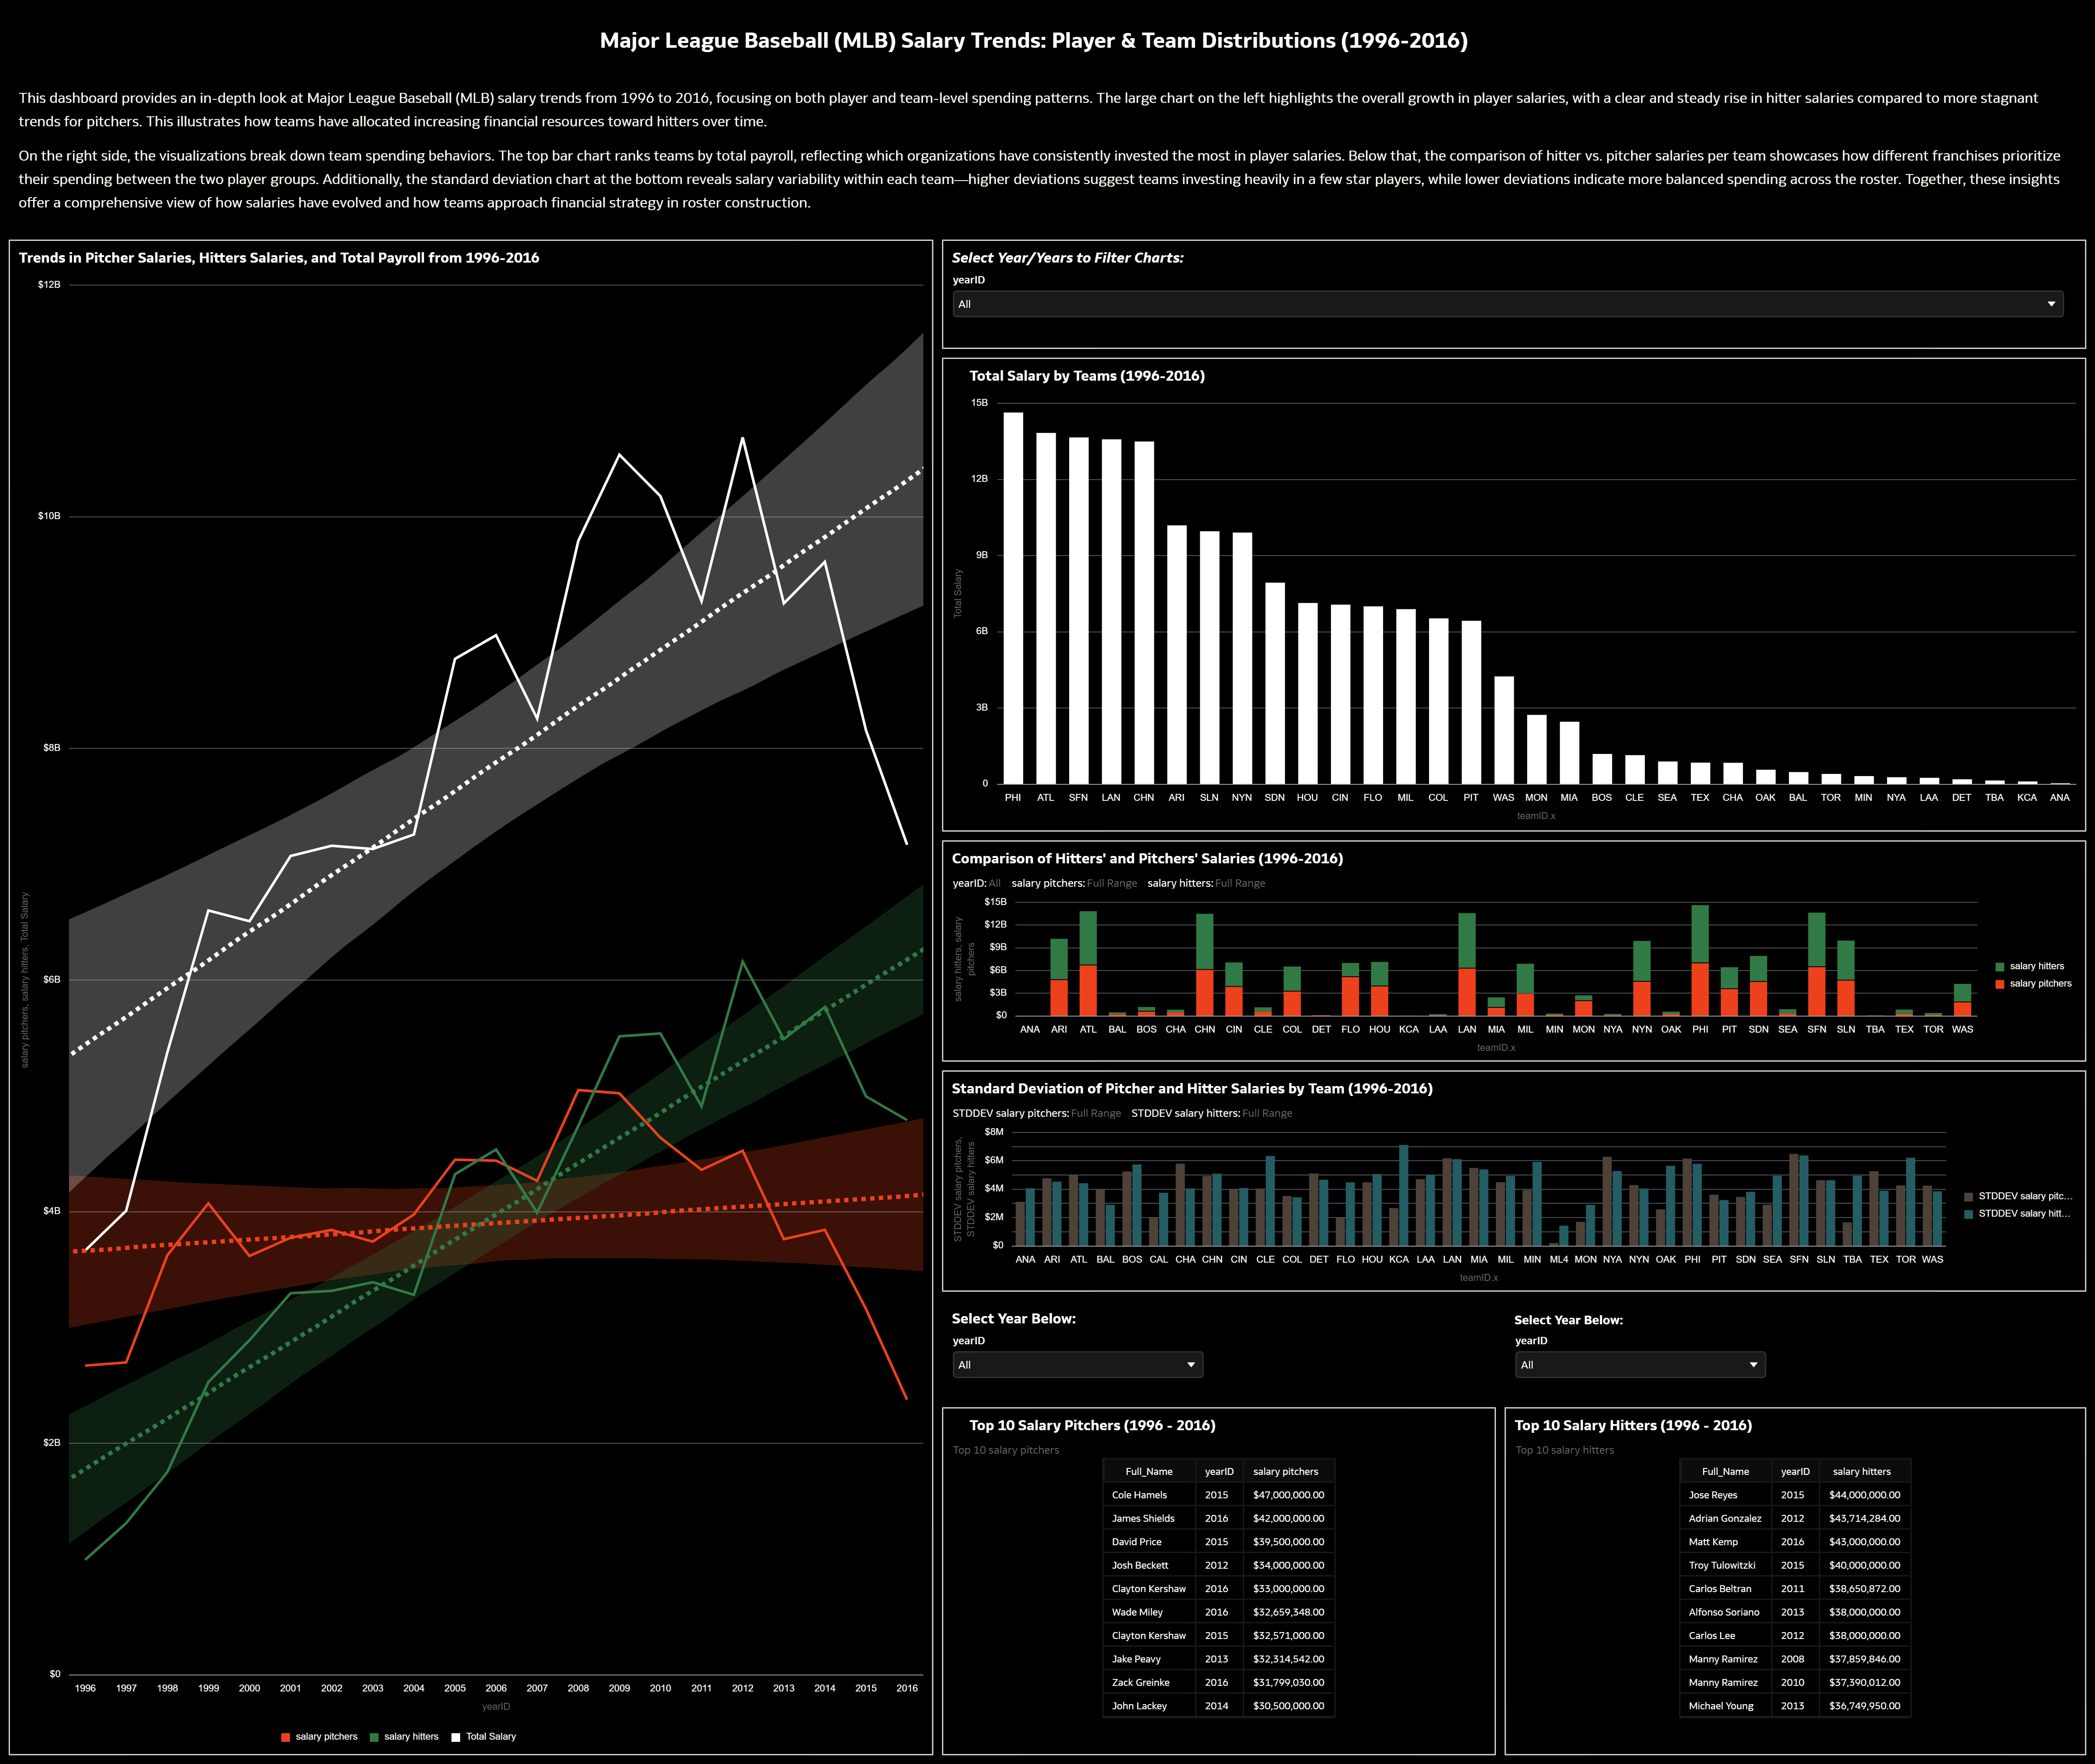
This data visualization explores MLB salary trends from 1996 to 2016, focusing on the distribution of salaries between hitters and pitchers, as well as how teams allocate payroll. The primary audience includes baseball analysts, front office personnel, and fans interested in understanding long-term financial trends in player contracts. The goal is to highlight the steady rise in hitter salaries compared to the fluctuating nature of pitcher salaries while also examining team spending behaviors, salary variability, and financial strategy in roster construction.
7
Comments
-
Excellent work @User_J2JMI ! who is your favorite MLB team?
1
