Categories
- All Categories
- 5 Oracle Analytics Sharing Center
- 11 Oracle Analytics Lounge
- 195 Oracle Analytics News
- 41 Oracle Analytics Videos
- 15.5K Oracle Analytics Forums
- 6K Oracle Analytics Idea Labs
- Oracle Analytics User Groups
- 68 Oracle Analytics Trainings
- 14 Oracle Analytics Data Visualizations Challenge
- Find Partners
- For Partners
Days of Inventory Coverage

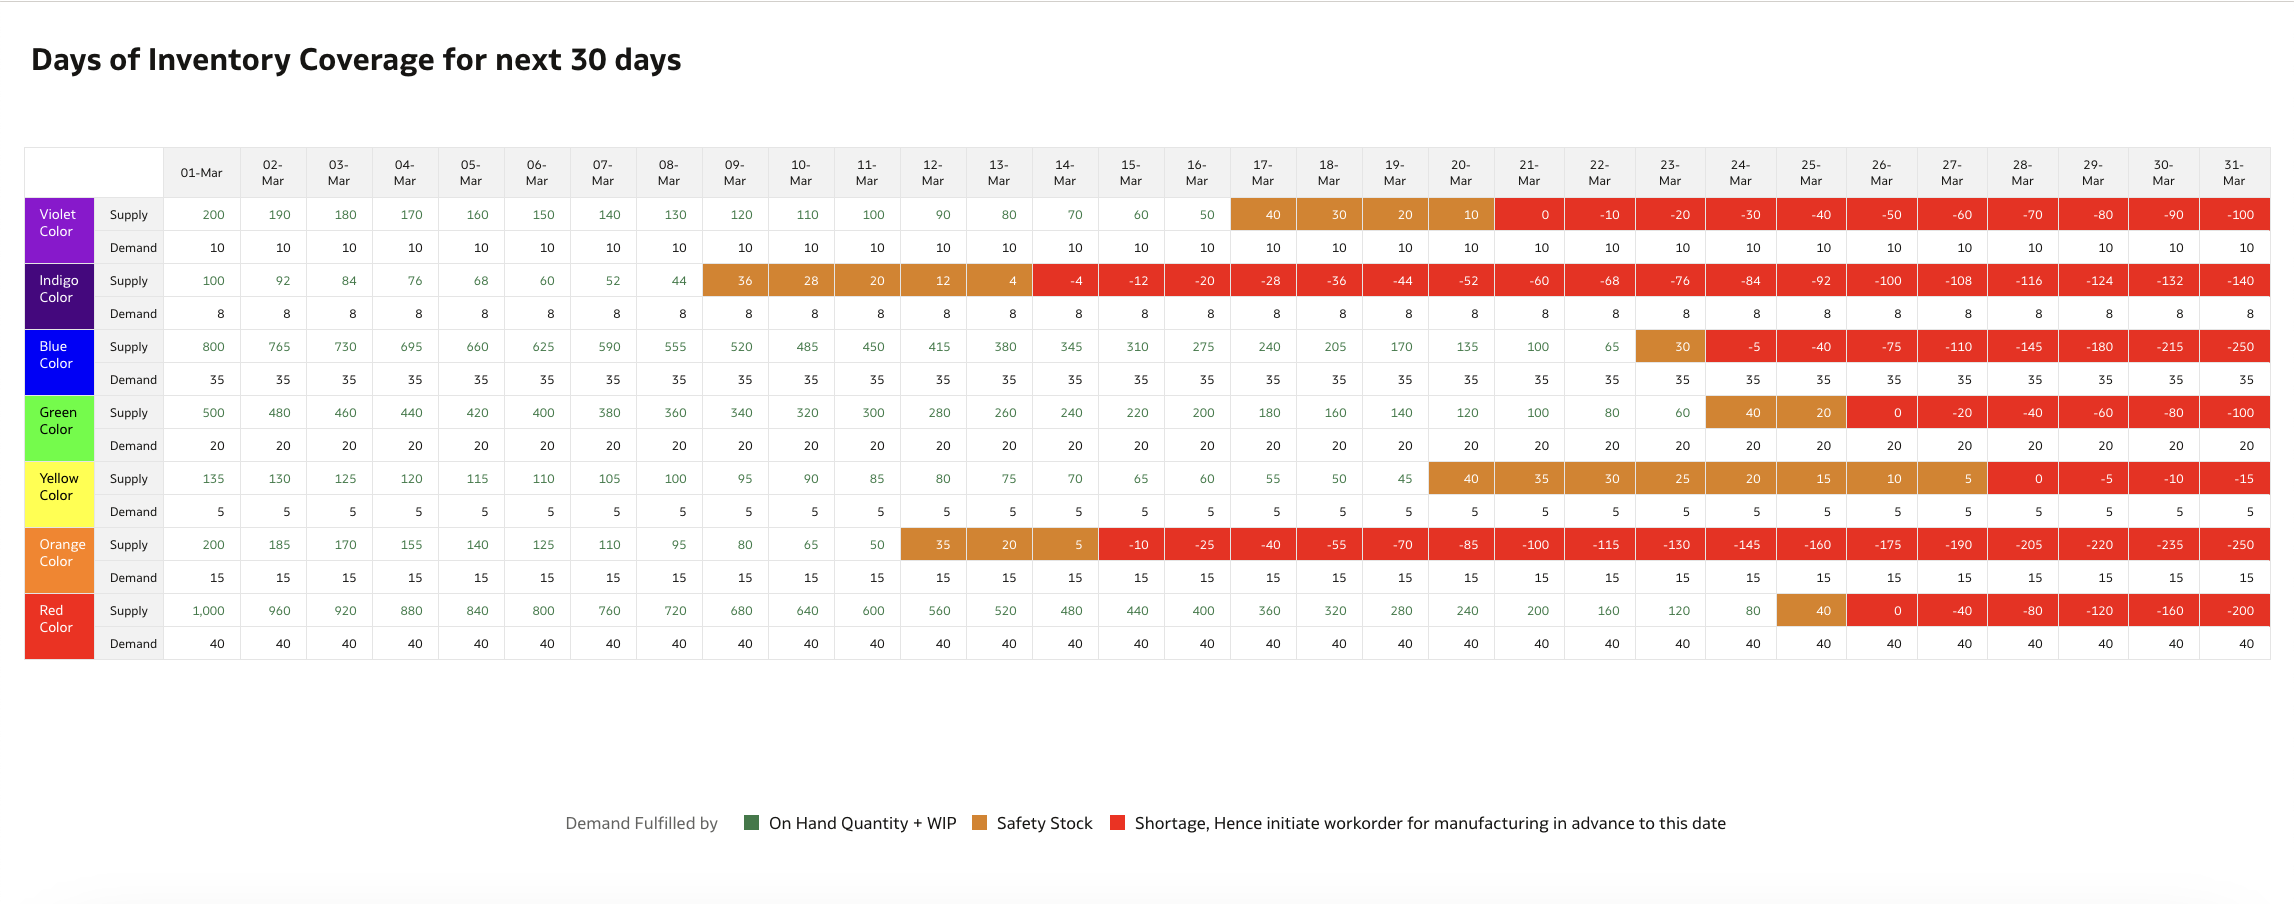
This visualization illustrates how long the current On-hand inventory, including Safety Stock, will cover the upcoming demand for different colored products. It also aids in making proactive decisions on when to initiate work orders for products with high demand.
Comments
-
Nice visualization, Thanks for sharing!
2 -
I love the simple and clean way of displaying the status day-by-day
3 -
Simple & efficient
2 -
Easy to understand and very professional look & feel.
Thanks for sharing @aravinddarla-Oracle!
0 -
This looks very efficient, will get to decision very quick!
0 -
This is fantastic! @Benjamin Arnulf-Oracle is there something in Oracle that can do this already? Our team is executing such reports and visualizations manually in Excel monthly. Such reports take us 1-2 days to complete. It's akin to running a manual MRP in Excel…
0 -
Yes - Oracle Analytics can do that easily with Conditional Formatting.
1 -
Thanks @Benjamin Arnulf-Oracle! I'll send this off to our team.
1


