Categories
- All Categories
- 5 Oracle Analytics Sharing Center
- 11 Oracle Analytics Lounge
- 195 Oracle Analytics News
- 41 Oracle Analytics Videos
- 15.5K Oracle Analytics Forums
- 6K Oracle Analytics Idea Labs
- Oracle Analytics User Groups
- 68 Oracle Analytics Trainings
- 14 Oracle Analytics Data Visualizations Challenge
- Find Partners
- For Partners
World Development

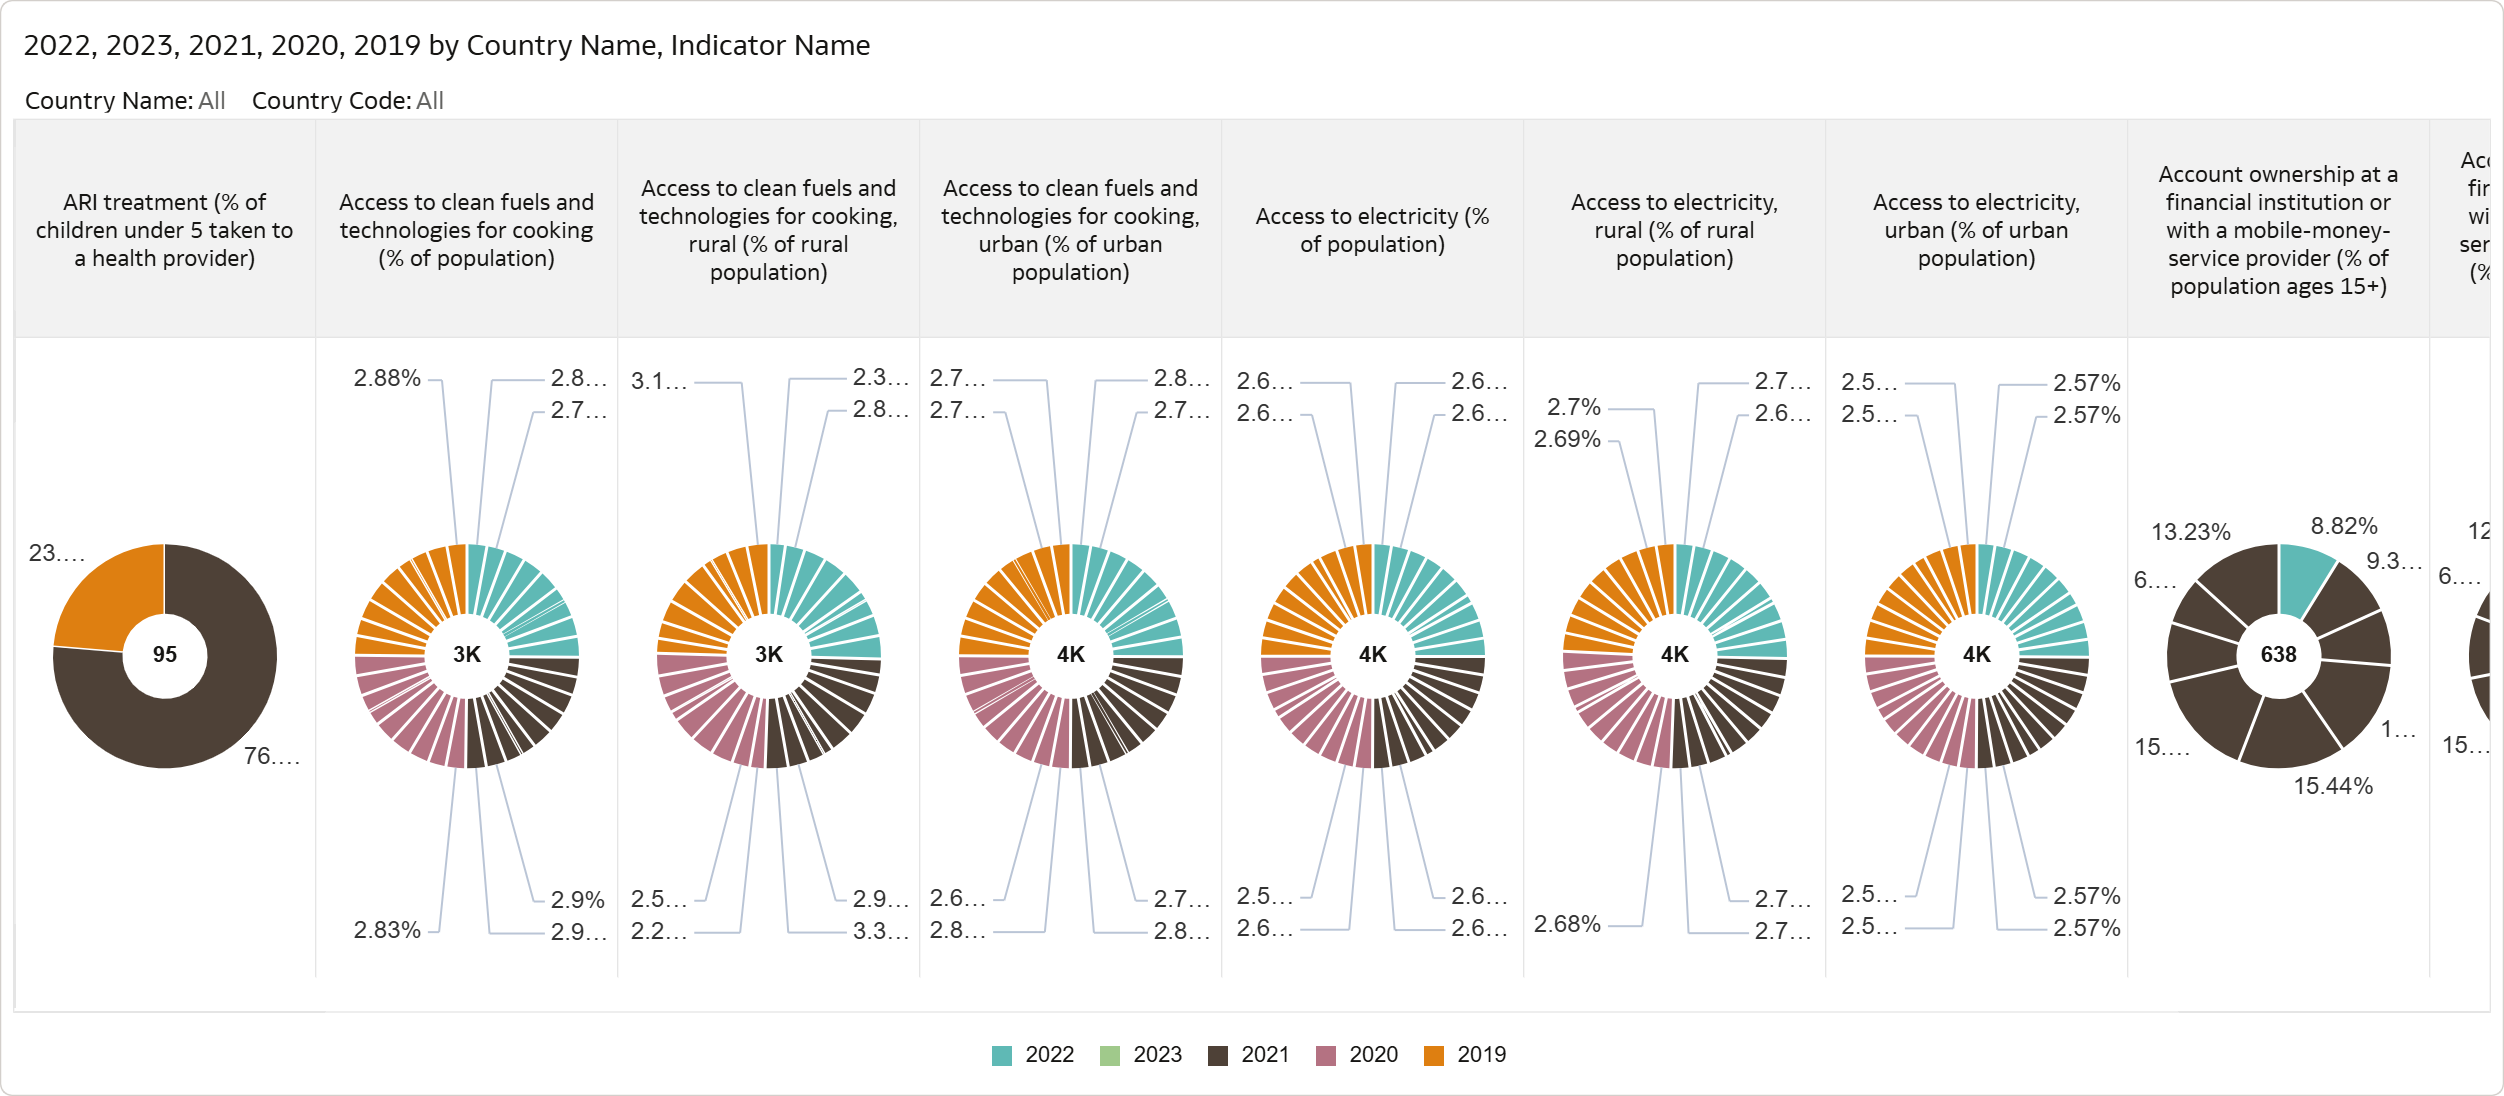
I wanted to present my data visualization by incorporating various filters, including Country, Year, and Development Indicators. This functionality allowed for a comprehensive comparison of countries over multiple years (2019, 2020, 2021, 2022, and 2023) across all development indicators. What truly amazed me was the speed at which OAC imported nearly 400,000 rows of data in just a few minutes, making it ready for use in various visualizations.
I was absolutely amazed by the numerous ways we could visualize and engage with it in OAC. I’m thankful for the opportunity to explore such a powerful tool, which has set a new benchmark for creating visually impactful analyses. The rich features and flexibility of OAC have made a strong impression on me, and I particularly going to recommend it to my various clients who might have need to analyze the data.
Comments
-
Thank you for sharing your visualizations and your experience with OAC!
0
