Categories
- All Categories
- 5 Oracle Analytics Sharing Center
- 11 Oracle Analytics Lounge
- 196 Oracle Analytics News
- 41 Oracle Analytics Videos
- 15.5K Oracle Analytics Forums
- 6K Oracle Analytics Idea Labs
- Oracle Analytics User Groups
- 68 Oracle Analytics Trainings
- 14 Oracle Analytics Data Visualizations Challenge
- Find Partners
- For Partners
Welcome to the Oracle Analytics Community: Please complete your User Profile and upload your Profile Picture
FDI - This dashboard helps analyzing HCM Helpdesk data with drill down upto a single ticket level

Neeti Choksi-Oracle
Rank 5 - Community Champion

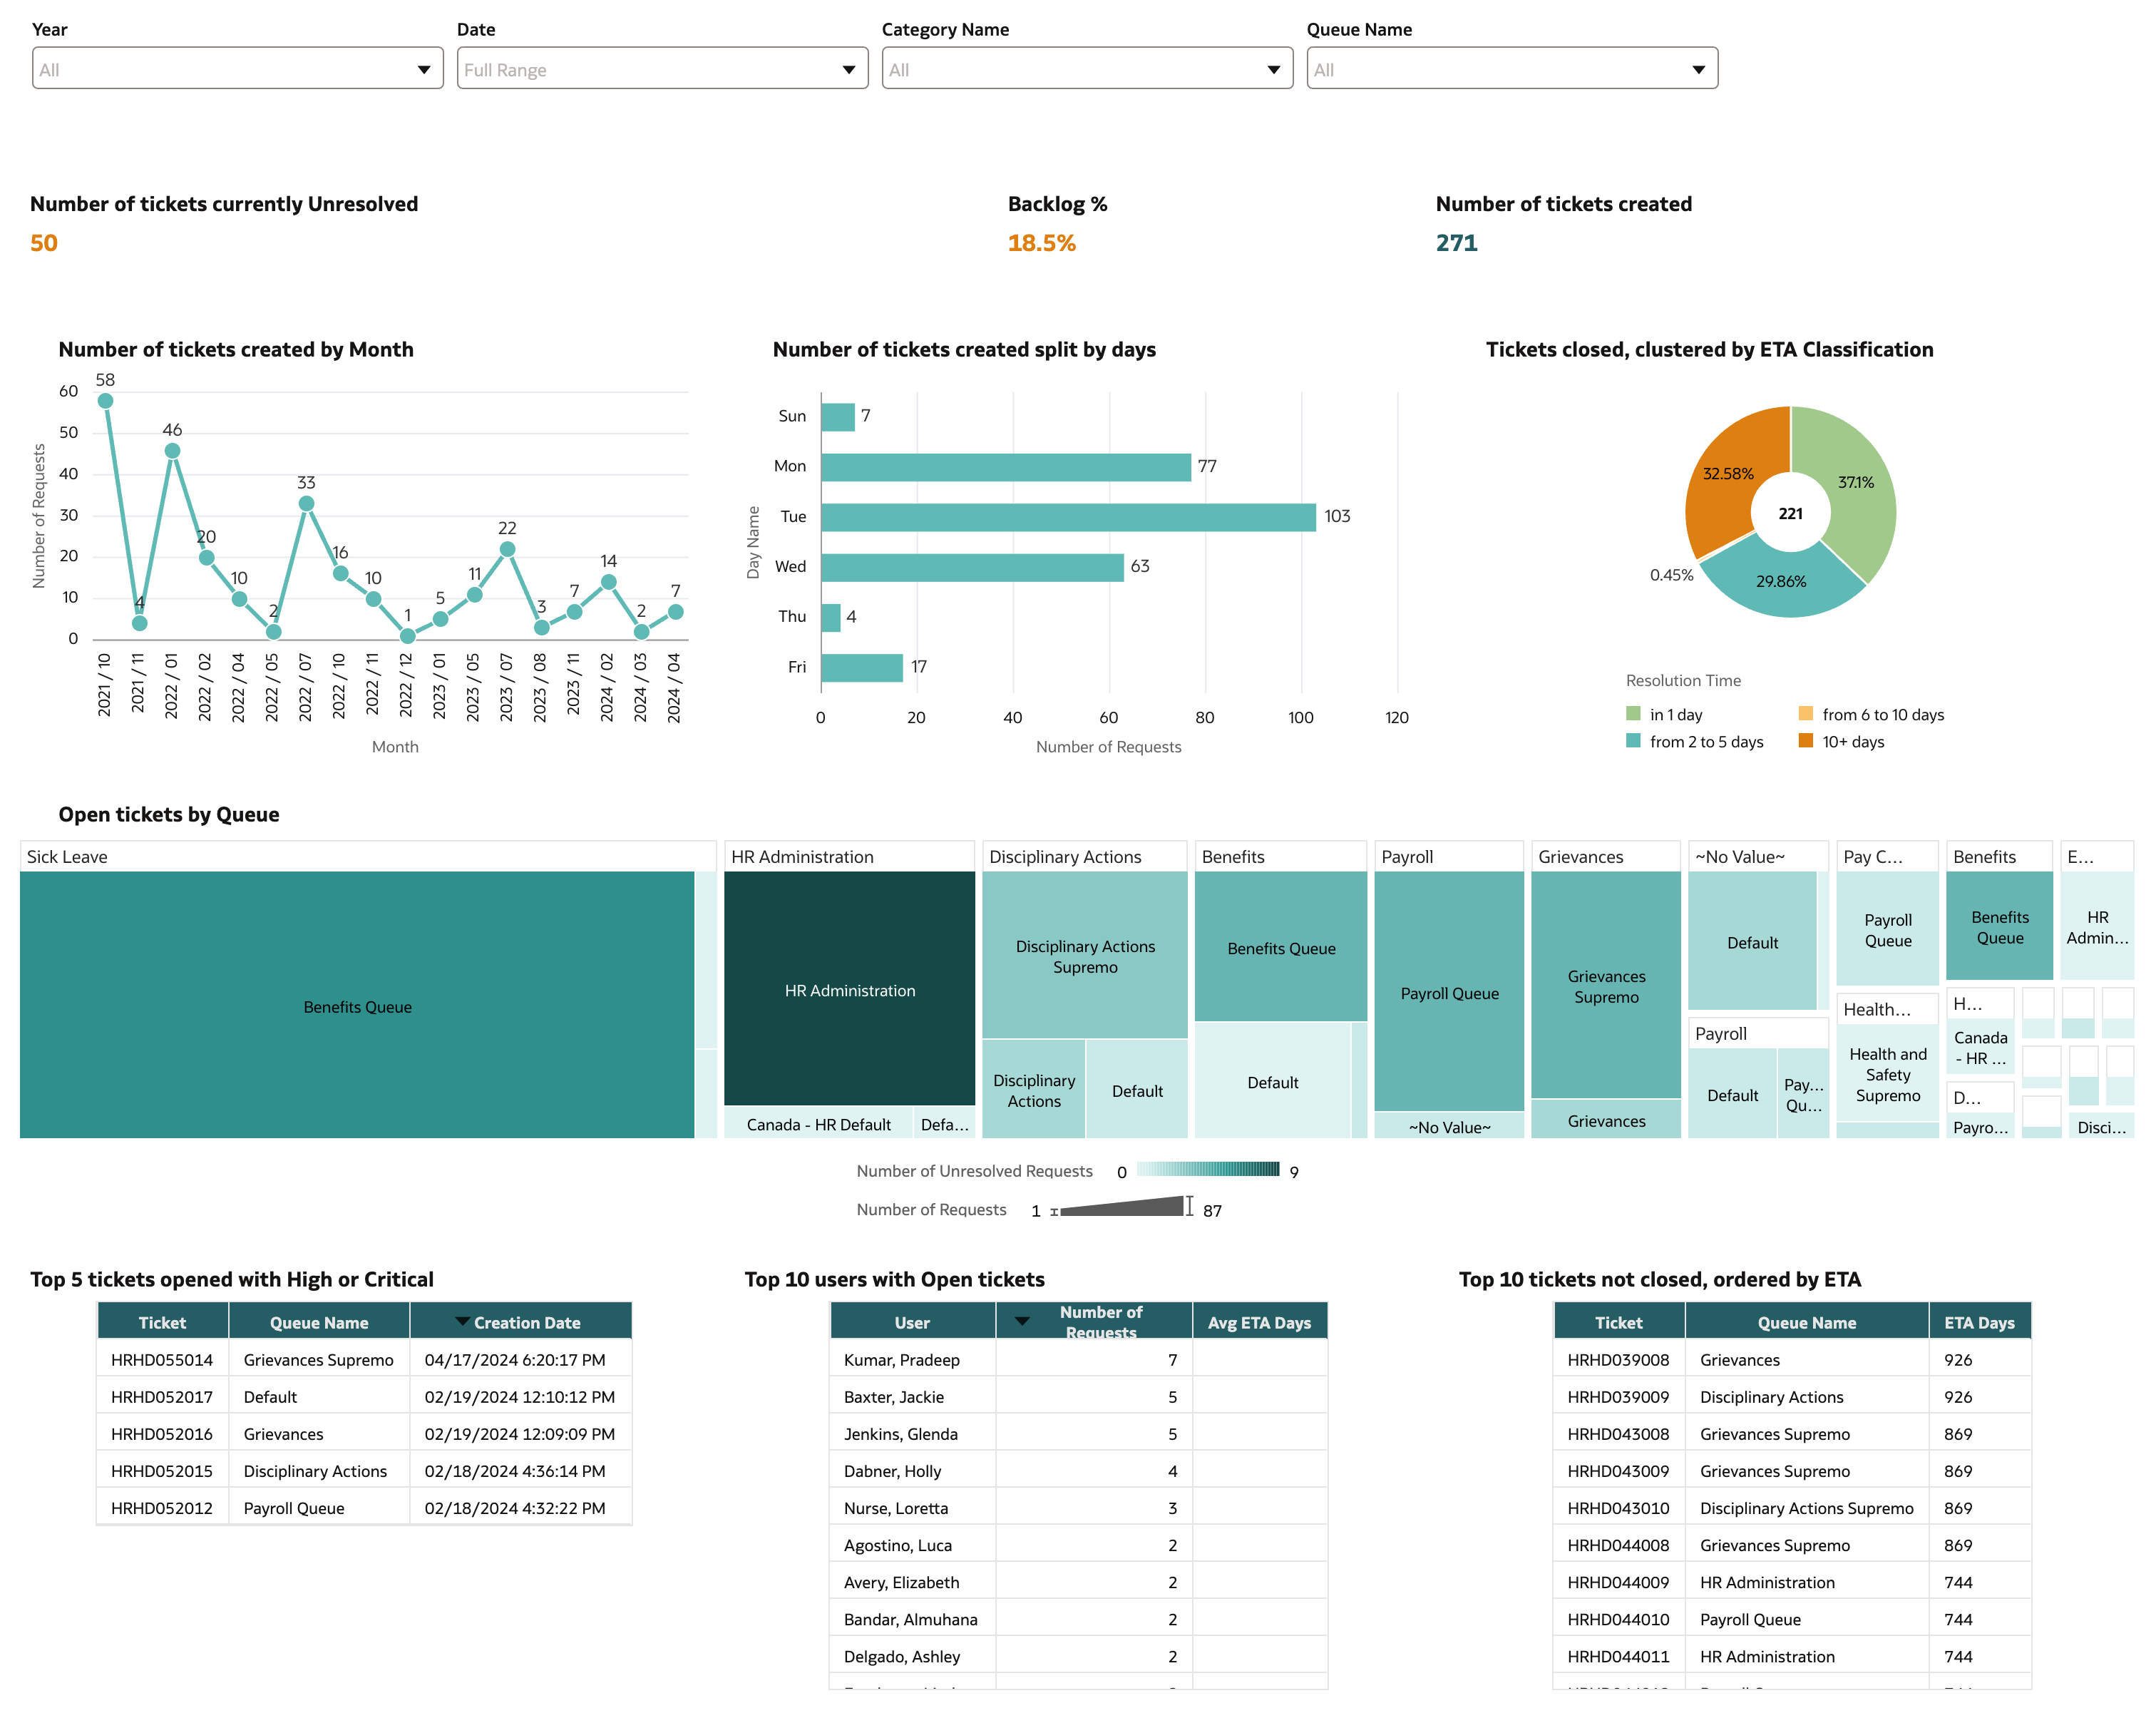
This FDI dashboard can be used to visualize data from HCM - Helpdesk module. The dashboard contains the following information -
Summary page
- Number of tickets created
- Number of tickets currently unresolved
- Backlog %
- Number of tickets created by month
- Number of tickets created split by days of the week
- Tickets closed, clustered by ETA classification
- Open tickets by queue and category
- Top 5 tickets opened with High or Critical
- Top 10 users with open tickets
- Top 10 tickets not closed, ordered by ETA
Drill down to All tickets details
Right click on tickets to drill down to view all details about a ticket


Tagged:
7
Comments
-
Easy to read and I love the colour way. I'm assuming it can be updated to match company branding?
0 -
Well thought out layout providing lot of metrics in single pane. Thanks for sharing the DVA.
0

